Continue Testing of our Pressure Sensor

In our efforts to continue to test and characterize our cleanroom pressure sensor we built a miniature cleanroom out of a cardboard box and an old computer fan. To improve the ability of this home-made, leaky chamber we sealed the entire box in plastic tape and punched a very tiny hole in the top of the box. These addons certainly did not make the box clean but it did make it possible to create a small positive pressure in the box, which we dubbed “test-chamber A”. The A is for amateur- thrown-together in an hour.

When we powered the fan we were able to generate a positive pressure of between 0.023 and 0.041″ of water. Our Cleanroom pressure sensor, which we installed with a passive wall plate, was able to correctly display and log the readings over several days. It responded immediately to changes in the pressure when the fan was turned off, going to 0.000″ within about 20 seconds. Once the fan was turned by on the pressure built up to the expected 0.030″ within a minute.

One thing we noticed was that the pressure bounced back and forth a bit reflecting the changes in pressure as air escaped through not only the pin hole in the top of the box but also through the fan itself. This very much reflects what happens in a normal sized clean room. The only way to stop the fluctuation would have been to cover the fan and the pin hole once the pressure had built up. Assuming the box was completely sealed the pressure would have stabilized at some value. Actual cleanroom pressures bounce around a bit also as air escapes through door frames, around fan enclosures and other minute openings. This is normal and is reflected in the pressures displayed on the QuickCheck monitor. It is possible to buffer the pressure a bit by averaging the pressures, which is allowed by the 2di CleanRoom monitor. The average setting can be changed on the sensor setup menu to fast, medium or slow. Setting the averaging to medium or slow would cause the displayed pressure to be a little more stable. However, bear in mind that we are measuring very small pressures, down to thousands of an inch, so any small change in the environment will cause a change in pressure

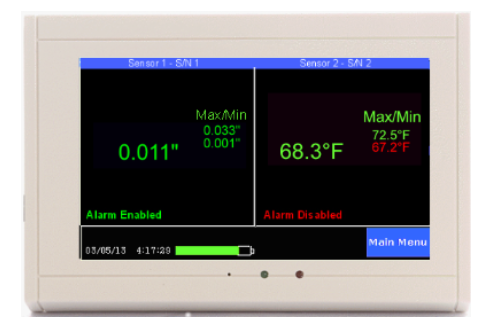
Step two was to test the QuickCheck display, which we did by setting the alarm pressure to 0.010″.

QuickCheck display showing low pressure reading

. Once the fan was turned off the pressure reading turned red indicating that it had dropped below our alarm threshold. And after 10 minutes the alarm sounded, the screen flashed, and an email message was sent showing that the pressure had fallen below the safe threshold.

We did not hook the strobe up of this test but had it been in place the strobe would have begun flashing. The ten minute delay in the alarm was set in the alarm menu to eliminate false alarms which might occur if the door had been opened. (Not a likely scenario for our miniature cardboard box). This delay feature is very important for our customers who do not want to be texted every time someone opens the door causing a drop on room pressure.

Our very limited testing has verified that the 2di CleanRoom pressure sensor can pick up very small changes in pressure and responds in every way expected.

TV2 monitor displaying temp, rh, and pressure

Verifying Cleanroom safety with a glance

Using the QuickCheck monitor to verify a Cleanroom is safe to enter.

The QuickCheck monitor continually updates the Cleanroom conditions and shows a visual indication of its safety conditions.  In our example the Cleanroom monitor is showing the pressure, temperature and humidity inside one room.  The left panel is showing a reading of 0.16″ of H2O and the right hand panel is showing a current temperature of 71.6°F and a current relative humidity reading of 53%.

TV2 Clean Room monitor

The current readings each appear in a green type face, which means that the conditions are within the set safety parameters.  However the minimum pressure is showing up as a red -0.08″ H2O.   This means that sometime in the past, the pressure has dropped below our safe threshold, which in this case is set to 0.00″H2O.  Just looking at this screen there is no way to determine when it dropped into unsafe territory, but if you touch the current reading the screen will change to a chart display and you can quickly see when this drop in QuickCheck display showing low pressure readingpressure occurred and how long it lasted.


Just a few seconds after the pharmacist checked the screen on the left it changed to look like the image on the right that is showing the pressure has dropped to an unsafe condition.  It has dropped to -0.01″ H2O.  This is a RED condition meaning that it is unsafe and personnel should not enter the room until it is corrected.

Now, how did the Cleanroom monitor know what the safety thresholds are?  The user set them in the alarm setting screen of the sensor.  In this case the pressure threshold is set to 0.0″ of H2O.  Although we can not tell what the value of the threshold is by looking at the QuickCheck screen, we can tell that it has been set to some value because at the bottom of the left hand panel the alarm message says ‘Alarm Enabled‘ and it appears in green.  If it were not set it would say ‘Alarm Disabled’ and would appear as red.

The best way to use this QuickCheck display is to mount it near the door to the cleanroom itself where each person who is about to enter can see it.  If they see RED anywhere on the display they should not enter until the condition is corrected.  If the temperature is red the thermostat may need to be lowered.  If the humidity is red the humidistat could be set to high be adjusted.  And of course if the pressure is showing in red the fan controls might need to be changed.

There is another feature of the QuickCheck display which actually can create a log of these quick checks by your employees.  The blue “Last Review” button at the bottom of the display can be used to create a log of cleanroom checks.  Any time the ‘Last Review’ button is touched a mark is placed on the conditions log.  Although it does not tell you who reviewed the data it does indicate that some one looked at the display and ‘reviewed’ the conditions.  When the data is downloaded to a PC for printing, archiving or just reviewing a vertical line will note each ‘Last Review’ button push, and a date and time stamp will appear in the ‘Alarm Log’ for each one.


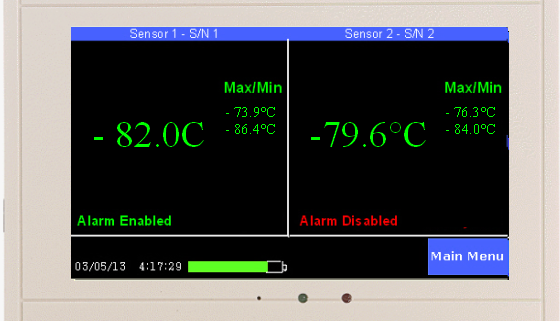
TV2 monitoring 2 -80 freezers

Data Logger

A data logger is basically a digital recording device that stores data at specific intervals. This logged data can be many things, but in most cases a data logger collects temperature and humidity information from a specifically defined environment.

Data loggers typically consist of a master control unit (to set data collection intervals, set threshold boundaries and to export collected data) and an array of sensors which actually sample the environment and report information.

4-freezes-fridges

If temperature and relative humidity (RH) are collected by a data logger, then there must be a temperature sensor calibrated to sense and report temperatures being monitored and a humidity sensor that can detect the amount of water in the environment.

Data loggers are used in almost all industries in the industrialized world. From ensuring food safety to maintaining sterile conditions in medical facilities, data loggers are an integral part of day-to-day life. Probably one of the most widely utilized features of commercial data loggers available is the ability to collect and store data 24 hours a day, 7 days a week. This gives anyone interested, an exportable data set to determine what environmental conditions existed at any point in time.

It is common for data loggers to provide data that may save lives or prevent catastrophe. For instance, a data logger may be used in a pharmaceutical application or medical office where a temperature sensor is monitoring a medical refrigerator housing expensive vaccines. If at some point the temperature drops in the vaccine fridge while no one is actively monitoring it, the vaccines could become ineffective and no one would ever know…until it was too late. Likewise with a great number of medicines and organic/biological applications. Another example might be a data logger in commercial construction. In order for concrete to maintain structural integrity, it must cure at a very specific temperature and humidity level.  Imagine concrete used for a bridge or high-rise building; without the ability to review temperature/humidity history from pour to cure.  A disaster waiting to happen since any compromise in the curing process could end in disaster. This is why it is important to have a dependable and accurate data logger involved in any process where human life is concerned.

Data Logger Types

Wireless Data Logger: A wireless data logger allows for greater flexibility and post-construction applications. In a wireless data logger, the sensors transmit data samples wireless to a central control device. No wires means system installers can position the sensors almost anywhere a signal can reach.

Thermocouple Data Logger: A thermocouple data logger is a type of data logger that collects temperature information with thermocouple sensors. Thermocouples are classified by various types. The type classification denotes the temperature range it can monitor and its accuracy. Below are the same types of thermocouples and their related temperature ranges of operation.

Type K Thermocouple (Nickel-Chromium / Nickel-Alumel): The type K is the most common type of thermocouple. Inexpensive, accurate, and reliable, with a wide temperature range.

Temperature Range:

  • Thermocouple sensor, –454°F to 2,300°F (–270°C to 1260°C)

Accuracy:

  •  +/- 2.2°C or +/- 0.75%
  • Special limits K-type thermocouple: +/- 1.1°C or 0.4%

Type J Thermocouple (Iron/Constantan): The type J is also very common. Lower temperature range and a shorter lifespan at higher temperatures than the Type K but with much better accuracy.

Temperature Range:

  • Thermocouple range, -346°F to 1,400°F (-210°C to 760°C)

Accuracy:

  • Standard: +/- 2.2°C or 0.75% above 0°C
  • Special: +/- 1.1°C

Type T Thermocouple (Copper/Constantan): The Type T is a very stable very accurate thermocouple that can be used for extremely low temperature applications such as cryogenics or ultra low freezers.

Temperature Range:

  • Thermocouple range-454°F to 700°F (-270°C to 370°C)

Accuracy:

  • Standard: +/- 1.0°C or +/- .75%
  • Special: +/- 0.5°C or 0.4%

Type E Thermocouple (Nickel-Chromium/Constantan): The Type E has a stronger signal & higher accuracy than the Type K or Type J at moderate temperature ranges of 1,000°F and lower.

Temperature Range:

  • Thermocouple range, -454°F to 1600°F (-270°C to 870°C)

Accuracy:

  • Standard: +/- 1.7°C or +/- 0.5%
  • Special: +/- 1.0°C or 0.4%

Type N Thermocouple (Nicrosil / Nisil): The Type N shares the same accuracy and temperature limits as the Type K. The type N is slightly more expensive.

Temperature Range:

  •  Thermocouple sensor, -454°F to 2300°F (-270°C to 392°C)

Accuracy:

  • Standard: +/- 2.2°C or +/- .75%
  • Special: +/- 1.1°C or 0.4%

Type S Thermocouple (Platinum Rhodium – 10% / Platinum): The Type S is used in very high temperature applications. It is commonly found in the BioTech and Pharmaceutical industries. It is sometimes used in lower temperature applications because of its high accuracy and stability.
Temperature Range:

  • Thermocouple grade wire, -58°F to 2700°F (-50°C to 1480°C)

Accuracy:

  • Standard: +/- 1.5°C or +/- .25%
  • Special: +/- 0.6°C or 0.1%

Type R Thermocouple (Platinum Rhodium -13% / Platinum): The Type R is used in very high temperature applications. It has a higher percentage of Rhodium than the Type S, which makes it more expensive. The Type R is very similar to the Type S in terms of performance. It is sometimes used in lower temperature applications because of its high accuracy and stability.

Temperature Range:

  • Thermocouple grade wire, 32°F to 2642°F (0°C to 1450°C)

Accuracy:

  • Standard: +/- 1.5°C or +/- .25%
  • Special: +/- 0.6°C or 0.1%

Type B Thermocouple (Platinum Rhodium – 30% / Platinum Rhodium – 6%): The Type B thermocouple is used in extremely high temperature applications. It has the highest temperature limit of all of the thermocouples listed above. It maintains a high level of accuracy and stability at very high temperatures.

Temperature Range:

  • Thermocouple grade wire, 32°F to 3100°F (0°C to 1700°C)

Accuracy:

  • Standard: +/- 0.5%
  • Special: +/- 0.25

Alarms: No data logger is complete without some form of advanced warning when a temperature or humidity error is detected. For instance, if a data logger is used to monitor vaccines or expensive medications, there should be data logger software in place to understand the error and send a notification to management personnel.

Ideally, the alarm would be multi-phase; whereas an event is triggered when a temperature range or humidity level falls outside a threshold, and a human is notified by email, phone and text alert. Additionally, it would be advantageous to have a room or loud local alarm to indicate an unsafe temperature or humidity level.

Data Storage: It would be beneficial for a data logger to have the capacity to store up to 80,000 data points over the course of a year or more. This would allow for a complete monitoring solution as well as secure backup. Having the ability to encrypt the data and export it over a secure LAN connection would ensure that it meets 21 CFR 11 standards and that users to have full control over all collected data.

Battery: Any data logger worth having must, operate if power is missing.  A good battery backup is essential.   It is common for power to fail; your data logger should not. A battery backup should be at a minimum of 72 hours; or, the length of time accumulated over a weekend. This would allow for continuity in monitoring and data collection in the event of a power failure. A data logger should always have a battery backup system – internal or external.

Very few data loggers available offer such a wide range of stability and versatility while maintaining high level of accuracy and dependability. The TV2 Temperature Monitor and Data Logger combines all features and capabilities important to monitoring temperature and relative humidity without compromise.

Learn more about this data logger 

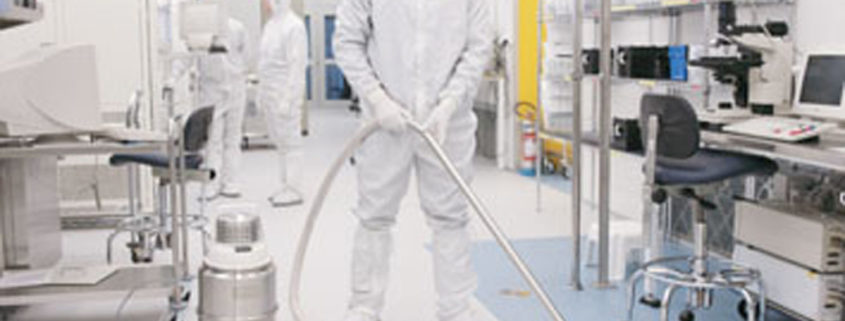
cleanroom with man in bunny suit and vacuum cleaner

Clean Room Design

Designing a clean room involves a great deal of consideration and planning prior to the actual build. Since there are numerous different cleanroom setups for varied uses, designing your clean room should be highly specific to the work that will be carried out once built.

Types of Clean Rooms

In addition to clean room standards discussed in previous articles, there are also differences in the physical construction materials and techniques in the clean room itself. Clean rooms can be built using sheet rock on metal studs, panel-post clean room systems, panel-panel clean room systems, double wall systems and furring wall systems. If you are thinking about modular clean room construction, expect higher costs than when using traditional building materials.

At the same time specific materials are being considered, it is also important to think about what the clean room will be used for. There are a few primary types of clean rooms: General clean room design, bio-pharmaceutical cleanrooms, ISO standard cleanrooms (microelectronics), and USP 797 cleanrooms (pharmaceutical/compounding).

Once the clean room use and materials are determines, it is important to next think about ventilation; the HVAC or airflow system in a clean room is at the core of what makes any room a clean room. Without properly designed airflow systems in place, a cleanroom is like any other room. Dirty.

Airflow in clean room design can be divided into two main categories, Single Pass Airflow Design and Recirculating Airflow Design. In a single-pass system, air surrounding the clean room is sucked in to the clean room through special filters, cleaned, and then expelled out of the clean room in to open air.

In a recirculating airflow design, air handling units (special clean room HVAC systems), the air is conditioned, drawn through low wall air returns and then into a ceiling plenum. Recirculating airflow cleanrooms are typically installed when there are temperature and relative humidity requirements. These help to isolate the clean room and air flow for greater environmental control.

Walls and Components

As with any cleanroom design, it is important that flexibility and the possibility for expanding the square footage of a clean room is an option. Many of the hardware and wall-based features of a clean room are specially designed to accommodate highly technical electronics, wiring and other fixtures.

Chase walls

Certain walls in cleanroom construction contain wire chases. These can exist in modular cleanrooms where there is solid core panels or traditional construction involving studs and paneling. The purpose of a wire chase is to have a conduit/routing system for electrical wiring and plumbing. In some cases, pneumatic air tubing or pressure

Chases can vary in depth size, depending on the overall thickness of the chase wall itself.

Bulkheads

For many cleanrooms, there is the constant need for new equipment to be moved in and out. Bulkheads are pre-designed penetrations in the cleanroom walls that accommodate appliances, hardware and other fixtures. They are usually sealed off, but have removable access panels by which a clean room user can insert hardware that is sealed once installed.

Seamless Walls, struts and batten wall systems in clean rooms are all optional configurations and accessory-driven additions that can make using a clean room easier and more functional in terms of design and production.

Cleanroom Design by Type

When considering your cleanroom, it is important to think about common focus patterns that are unique to various industries. Here is an example of some areas of focus for clean rooms:

Microelectronics: Attention to total particulate counts, process yields, reliability, functionality, and cost of ongogin operations.

Life Sciences/Bio: Concerned with physical matter in terms of contamination, must adhere to GMP regulations and guidelines, finishes must be easily wiped down, cleaned, and overall concerned with joints, crevices, recesses, adn overall cleanliness.

No matter why you are building a clean room, or what materials would suit you best, it is important to work with a builder that understands the unique challenges of operating a cleanroom.


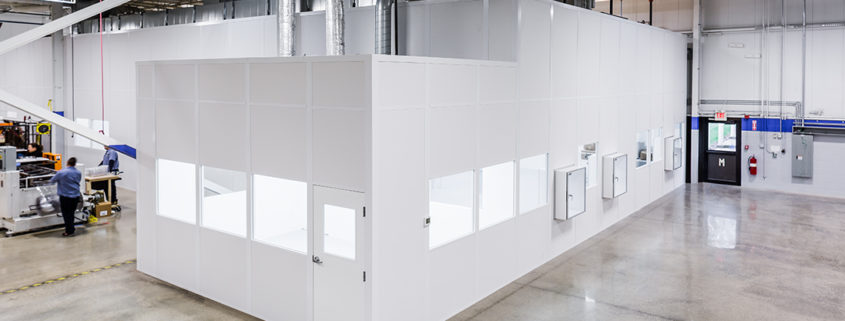
modular clean room

Cleanroom Standards and Guidelines

Cleanroom Classifications are based on a specific set of standards. These cleanroom classifications or “cleanroom standards” are numbered according to three primary areas of interest:

  1. Number of particles in the cleanroom air/environment
  2.  Size of the particles allowed in the cleanroom environment
  3. Total cubic ft. of air circulation in the cleanroom environment

While it may seem that these three criteria are relatively straightforward, it is actually a process that starts (and finishes) on a microscopic level. To make things even more difficult, different industries may require different default cleanroom standard start points. For example, the existing air quality and what is considered a base threshold in a factory may vary greatly from what is considered a base set point in a hospital or compounding pharmaceutical manufacturer.

Below is a standard cleanroom classification chart. Depending on the industry, the ISO requirement may differ greatly.

ISO 14644-1 Cleanroom Standards

Class

maximum particles / m3

FED STD 209E
equivalent

≥0.1 µm

≥0.2 µm

≥0.3 µm

≥0.5 µm

≥1 µm

≥5 µm

ISO 1

10

2.37

1.02

0.35

0.083

0.0029

ISO 2

100

23.7

10.2

3.5

0.83

0.029

ISO 3

1,000

237

102

35

8.3

0.29

Class 1 Cleanroom

ISO 4

10,000

2,370

1,020

352

83

2.9

Class 10 Cleanroom

ISO 5

100,000

23,700

10,200

3,520

832

29

Class 100 Cleanroom

ISO 6

1.0×10⁶

237,000

102,000

35,200

8,320

293

Class 1,000 Cleanroom

ISO 7

1.0×10⁷

2.37×10⁶

1,020,000

352,000

83,200

2,930

Class 10,000 Cleanroom

ISO 8

1.0×10⁸

2.37×10⁷

1.02×10⁷

3,520,000

832,000

29,300

Class 100,000 Cleanroom

ISO 9

1.0×10⁹

2.37×10⁸

1.02×10⁸

35,200,000

8,320,000

293,000

Room air

(µm denotes micron particle size)

Cleanrooms are divided up or given “cleanroom standards” based on particulate count. For example, with Class 100 Clean Rooms, they are designed to never allow more than 100 particles (0.5 microns or larger) per cubic foot of air.

Cleanroom Certifications

Clean rooms must be periodically certified/re-certified by a cleanroom ISO certification specialist. Most companies have their modular, hard wall clean room or softwall clean room certified for ISP cleanroom compliance once per year. Some pharmaceutical companies, or USP certified cleanrooms are certified once every 6 months. Aside form annual or bi-annual cleanroom cersifications, a re-certification is necessary if there is a cleanroom contamination event.

Typically, a classification specialist will check for these requirements:

  • Class 100-100k, ISO4-8
  • Per ISO 14644-1, ISO14644-2, and FS209E
  • Using NIST traceable calibrated instruments
  • Particle count
  • Room differential air pressure
  • Temperature
  • Humidity
  • Detailed test report with data map
  • Mountable inspection certificate
  • Individual HEPA FFU air flow w Velgrid (must be requested at time of quote)

For particle count, a benchtop particle counter is more accurate than a handheld option.

Once certified, it is up to the cleanroom operators to maintain environmental conditions inside the clean room.

Monitoring Positive Pressure in Clean Rooms

Clean rooms are required to maintain positive pressure so particulates like dust, dirt and debris are kept away from highly sensitive products while being manufactured. Clean rooms are required in a number of industries; from pharmaceutical manufacturing to industrial and food preparation.

cleanroom with man in bunny suit and vacuum cleaner

The TV2 Clean Room Monitor is a highly accurate and cost effective way to monitor clean room pressure. The TV2 Clean Room Monitor can measure pressure between ±0.5″ of water with an accuracy of +/- 0.002” of water. Other features include a 16-bit analog to digital converter, ability to chart and record temperature and relative humidity. The monitor can be calibrated by the manufacturer, or alternatively, higher accuracy can be achieved through user calibration.

About ISO Cleanroom Standards

Currently, there are global cleanroom classifications and standards set forth by the International Standards Organization (ISO). Before these current regulations, the U.S. General Service Administration’s standards (known as FS209E) were applied across the board – worldwide. Over time, the need for international standards grew, so the ISO established a technical committee and several working groups to establish it’s own set of standards for the cleanroom industry as a collective.

FS209E contains six classes, while the ISO 14644-1 classification system adds two cleaner standards and one dirtier standard (see chart below). The “cleanest” cleanroom in FS209E is referred to as Class 1; the “dirtiest” cleanroom is a class 100,000. ISO cleanroom classifications are rated according to how much particulate of specific sizes exist per cubic meter (see second chart). The “cleanest” cleanroom is a class 1 and the “dirtiest” a class 9. ISO class 3 is approximately equal to FS209E class 1, while ISO class 8 approximately equals FS209E class 100,000.

In November 2001, Federal Standard 209E was superseded by the new ISO 14644-1 international standards. References to FS209E are still used; the comparison chart below illustrates the relationship between the two standards.

Particulate Cleanliness Class Comparison:

ISO 14644-1 FEDERAL STANDARD 209E
ISO Class English Metric
ISO 1
ISO 2
ISO 3 1 M1.5
ISO 4 10 M2.5
ISO 5 100 M3.5
ISO 6 1,000 M4.5
ISO 7 10,000 M5.5
ISO 8 100,000 M6.5
ISO 9

Particulate Cleanliness Classes (by cubic meter):

CLASS Number of Particles per Cubic Meter by Micrometer Size
0.1 micron 0.2 micron 0.3 micron 0.5 micron 1 micron 5 microns
ISO1 10 2
ISO2 100 24 10 4
ISO3 1,000 237 102 35 8
ISO4 10,000 2,370 1,020 352 83
ISO5 100,000 23,700 10,200 3,520 832 29
ISO6 1,000,000 237,000 102,000 35,200 8,320 293
ISO7 352,000 83,200 2,930
ISO8 3,520,000 832,000 29,300
ISO9 35,200,000 8,320,000 293,000

In cleanrooms, particulate concentration will change over time — from the construction and installation of equipment to its operational status. ISO delineates three cleanroom classification standards: as-built, at-rest and operational. As people are added to the equation, particulate levels rise even further in the “operational” cleanroom.

ISO 14644-2 describes the type and frequency of testing required to conform to certain standards. The following tables indicate mandatory and optional tests.

Required Testing (ISO 14644-2)

Schedule of Tests to Demonstrate Continuing Compliance
Test Parameter Class Maximum Time Interval Test Procedure
Particle Count Test <= ISO 5 6 Months ISO 14644-1 Annex A
> ISO 5 12 Months
Air Pressure Difference All Classes 12 Months ISO 14644-1 Annex B5
Airflow All Classes 12 Months ISO 14644-1 Annex B4

Optional Testing (ISO 14644-2)

Schedule of Additional Optional Tests
Test Parameter Class Maximum Time Interval Test Procedure
Installed Filter Leakage All Classes 24 Months ISO 14644-1 Annex B6
Containment Leakage All Classes 24 Months ISO 14644-1 Annex B4
Recovery All Classes 24 Months ISO 14644-1 Annex B13
Airflow Visualization All Classes 24 Months ISO 14644-1 Annex B7

In addition to ISO 14644-1 and ISO 14644-2, eight other cleanroom standards documents exist, as well as three specific to biocomtamination applications.

ISO Document Title
ISO 14644-1 Classification of Air Cleanliness
ISO 14644-2 Cleanroom Testing for Compliance
ISO 14644-3 Methods for Evaluating and Measuring Cleanrooms and Associated Controlled Environments
ISO 14644-4 Cleanroom Design and Construction
ISO 14644-5 Cleanroom Operations
ISO 14644-6 Terms, Definitions and Units
ISO 14644-7 Enhanced Clean Devices
ISO 14644-8 Molecular Contamination
ISO 14644-9 Surface Cleanliness by Particle Concentration
ISO 14644-10 Surface Cleanliness by Chemical Concentration
ISO 14698-1 Biocontamination: Control General Principles
ISO 14698-2 Biocontamination: Evaluation and Interpretation of Data
ISO 14698-3 Biocontamination: Methodology for Measuring Efficiency of Cleaning Inert Surfaces

USP Cleanrooms

USP regulated cleanrooms are designed with positive pressure sensors and monitoring systems to meet (or attempt to meet) strict USP standards.

Under USP 797 regulations, compounding pharmacies are required to compound sterile preparations (CSPs) utilizing a laminar flow workstation within a clean room. It is also important for the exterior environment of the Laminar flow workstation to be free from particulates using a TV2 Cleanroom Monitor.

Sterile compounding is classified into 3 risk groups: Low Risk, Medium Risk, and High Risk. If a company prepares CSPs, which meet the definition of the specific categories, described in USP Chapter 797 you must comply with USP 797. The standards are intended to apply to all persons who prepare CSPs and all places where CSPs are prepared including physicians offices.

The USP 797 cleanroom requirements are general in nature, but refer to the International Standards Organization ISO-14644 standards for cleanrooms. To achieve USP 797 compliance, pharmacies must perform sterile drug compounding within an ISO 5 (Class 100) hood environment, enclosed within a larger compounding “Buffer Zone” of ISO 7 (Class 10,000) positive pressure controlled-air environment (Cleanroom).

For example: an ISO 5 compounding environment can be maintained utilizing a Laminar Flow Workstation within an existing ISO 7 cleanroom, or by designing and building a new ISO 5 cleanroom. Maintaining the proper positive pressure within the cleanroom must be evaluated and taken into consideration when designing a sterile cleanroom operating environment. The TV2 Cleanroom Monitoring System helps cleanroom manufacturers and designers comply with strict ISO and USP standards of operation.

Summary

In most large-scale FDA-regulated pharmaceutical manufacturing operations, it is required that the product be manufactured in a clean room classified between Class 100 and Class 100,000. In an operation where medical tubing is being extruded, the classification would likely be Class 100,000. In a process where inject-able drugs are being manufactured, the classification would most likely be Class 100 or Class 1000.

The purpose of the clean room is to eliminate contamination by particulate counts, some of which could potentially contain microorganisms or bio-toxins.  Cleanrooms provide a controlled physical environment with a close monitoring of temperature, pressure and humidity. Unlike most existing products on the market, the TV2 Cleanroom Monitor can measure, chart and digitally record all three variables simultaneously.

For cleanroom manufacturers and operators – monitoring these these three variables is no easy task. The intake air must be filtered and moisture and/or heat added or removed depending on the manufacturing taking place. In most cases, large fans located above the clean room force air through an elaborate filtering system. Likewise, air must be used to remove any contamination introduced by the occupants and materials taken into the clean room.

Of the three parameters being measured (temperature, positive pressure and relative humidity RH), pressure is the most critical to the proper functioning of the ISO/USP compliant clean room.

Since most clean room pressure sensors and monitoring systems operate at very low pressure differentials, normally in the range of 0.1 to 0.25 inH 2O, it is imperative that cleanroom manufacturers incorporate a solution that will consistently provide accuracy. The TV2 Cleanroom Monitor measures pressure between +1 inH 2O and -1 inH 2O with an accuracy of +/- 0.025 inH 2O.

The TV2 Cleanroom Monitoring System includes a high-accuracy propietary positive and negative pressure sensor, a temperature sensor (available in multiple spec ranges) and a relative humidity/RH sensor. Measurements are taken at chosen intervals, and all data is recorded with battery backup. Featured on-screen color coding immediately notifies clean room operators and employees of any “unsafe” conditions before entry and possible cleanroom contamination.